Beta
This website is in development — content and design are still changing
Tool
mipplot: open-source tool for visualization of climate mitigation scenarios
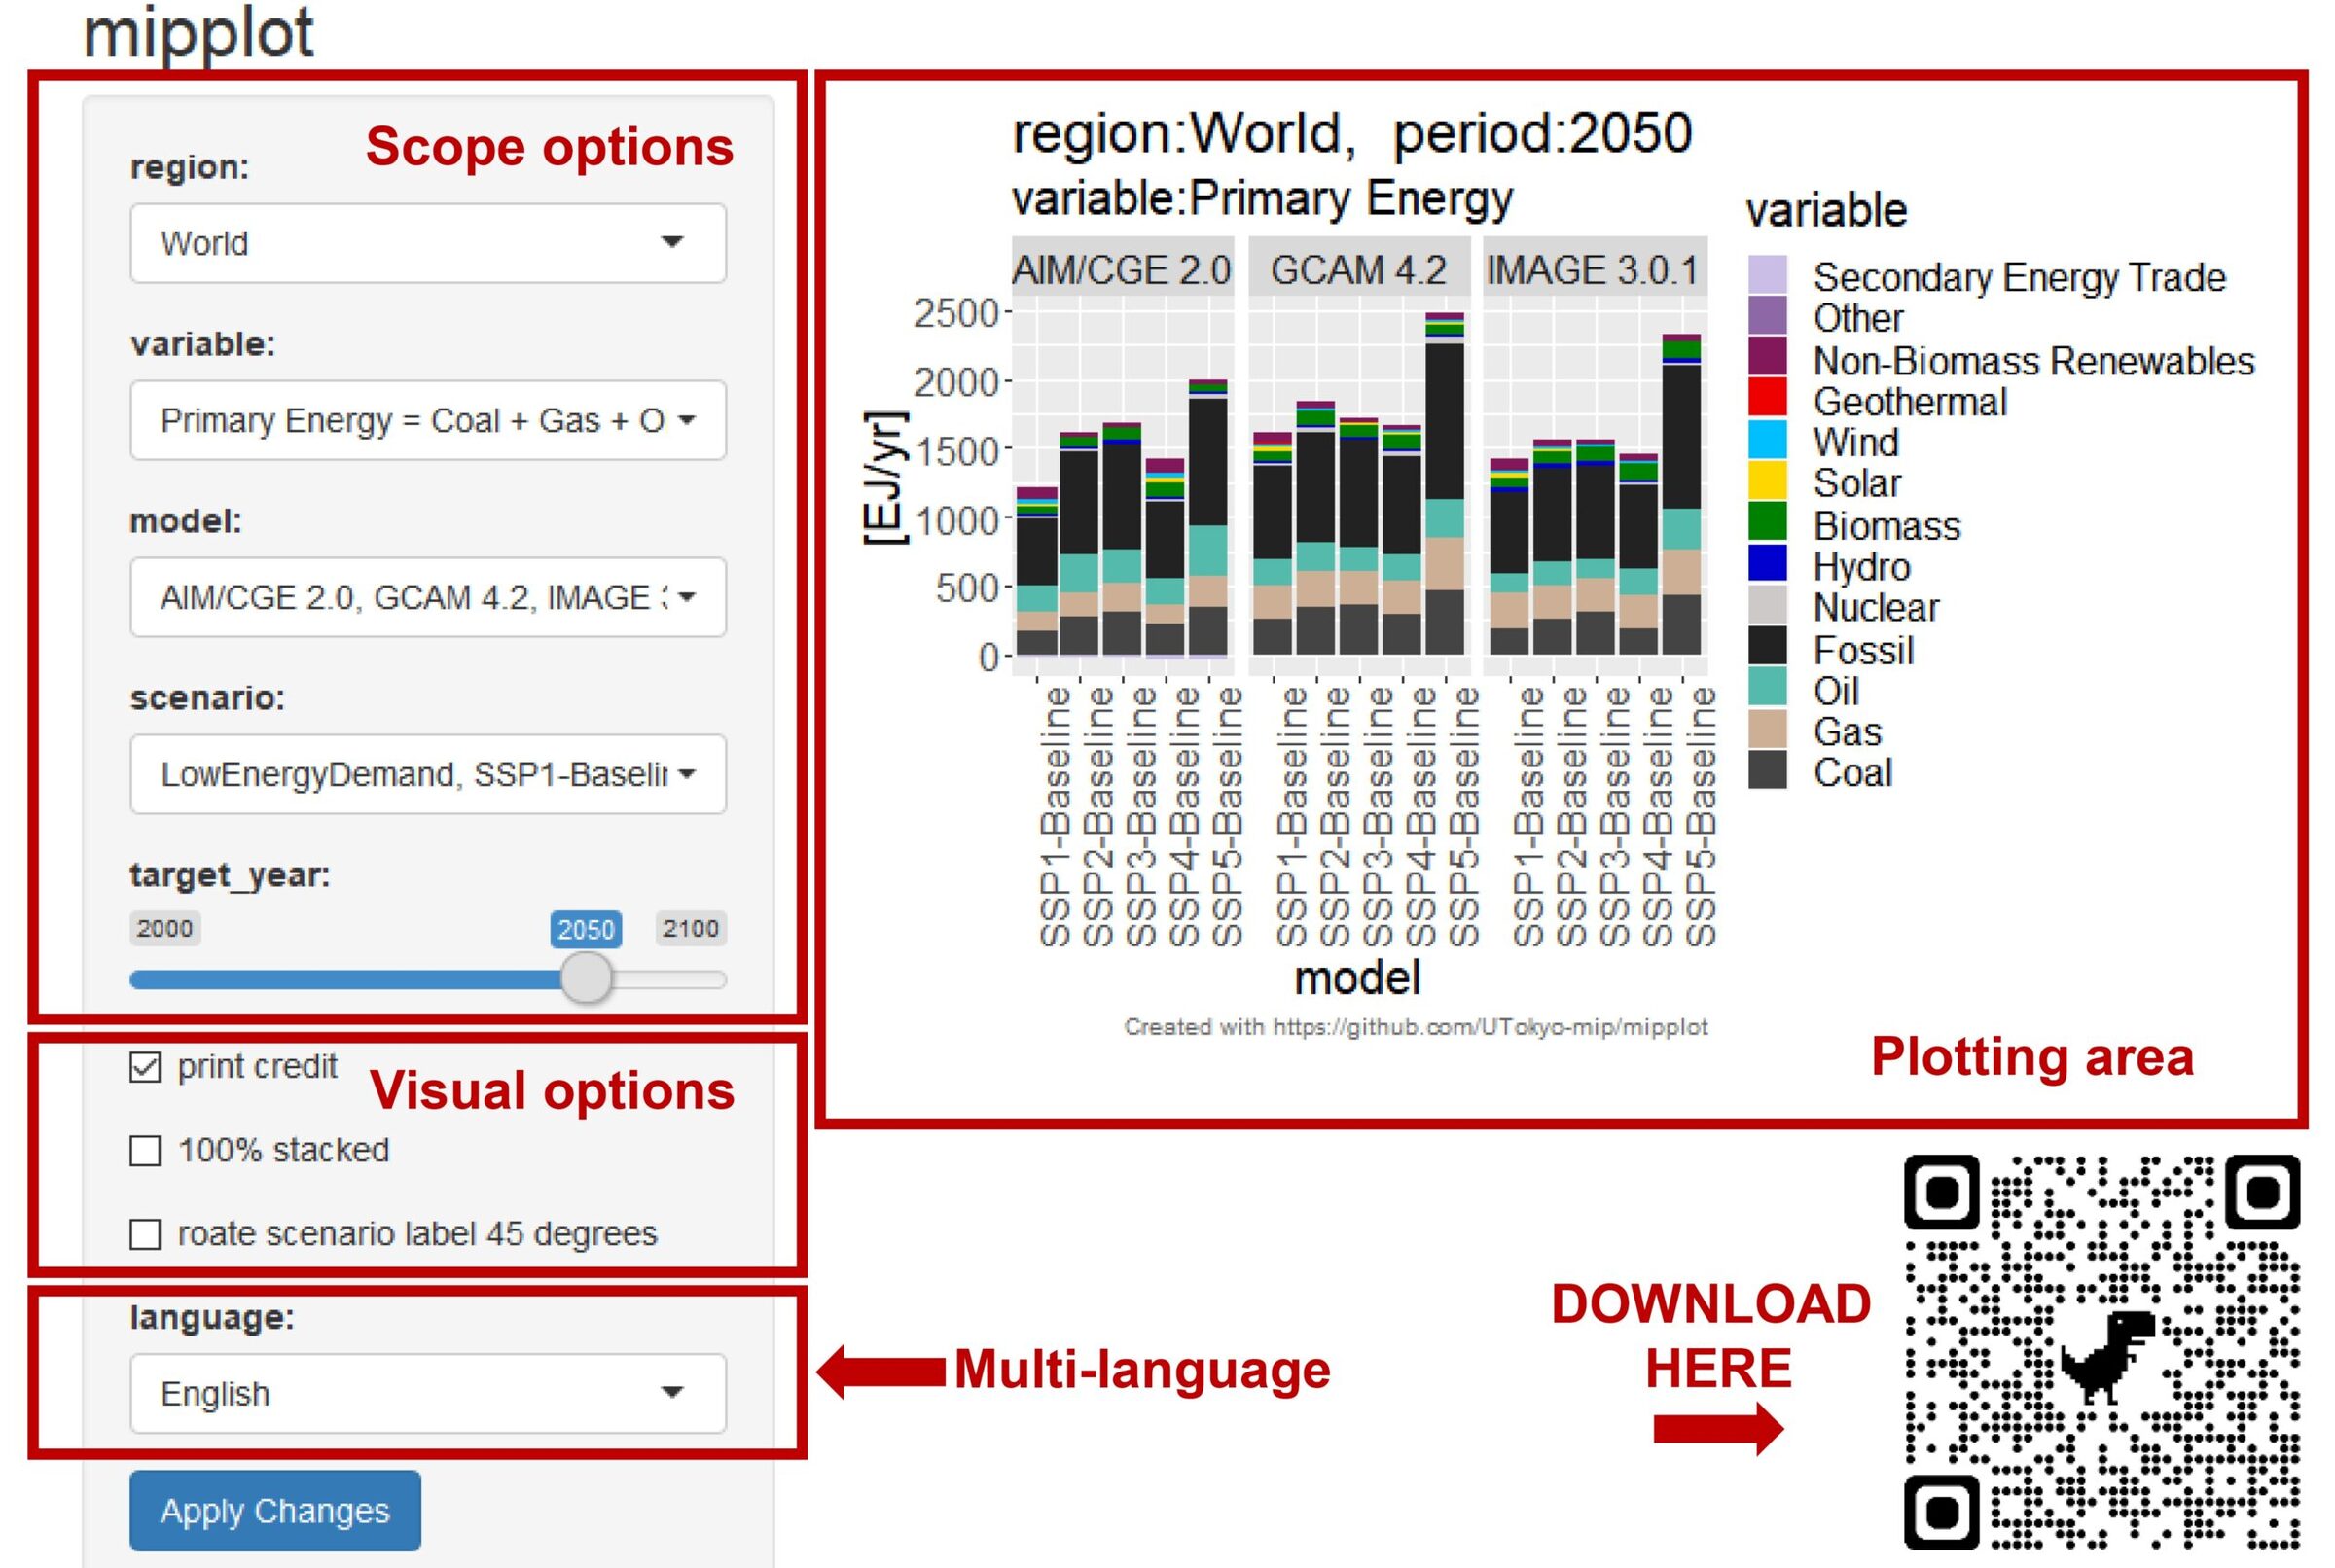
Synthesizing and communicating knowledge on climate change to policymakers and stakeholders is often difficult due to the complexity and diversity of underlying research. As a “translation” instrument, the open-source R package mipplot can be used to visualize data of long-term climate mitigation scenarios. With simple commands and under a user-friendly
Synthesizing and communicating knowledge on climate change to policymakers and stakeholders is often difficult due to the complexity and diversity of underlying research. As a “translation” instrument, the open-source R package mipplot can be used to visualize data of long-term climate mitigation scenarios. With simple commands and under a user-friendly R language platform, this tool generates plots in multiple languages for any scenario dataset following the data submission format of the Integrated Assessment Modeling Consortium.
The initial audience of mipplot are researchers and students interested in climate change mitigation scenarios, expected to be able to handle R packages via function calls. The tool’s design also aims to reach stakeholders without technical expertise on model or data manipulation, by including an interactive interface. With the two plotting approaches, mipplot offers greater flexibility of inputs and suits both experts and non-experts. Moreover, its capability of specifying aggregation rules and different display languages extends its applicability to a broader range of users.
Circular ReBoundary is a free online learning resource that helps businesses and organisations adopt circular economy practices effectively. Developed by CMCC (Euro-Mediterranean Centre on Climate Change) in close partnership with T6 Ecosystem and other research partners of the CircEUlar project, this tool addresses a common challenge: ensuring that well-intentioned sustainability efforts and
As part of the CircEUlar project, Centro Euro-Mediterraneo sui Cambiamenti Climatici (CMCC) is proud to announce the launch of Circular ReBoundary, a new online resource showcasing circular practices, testimonials, survey findings, and insights on rebound effects. More information is available here. In addition, you can discover Circular ReBoundary in action! Join
A team of European Climate and Energy Modelling Forum researchers has unveiled a new method to decode intricate energy and climate models. In a recent publication in Nature Energy, they introduce “model fingerprints,” a visual tool simplifying the comprehension of complex models’ key features. Energy models are crucial to understand